A few months ago I wrote here about how I’d analysed the results from a year 10 class test with a spreadsheet to give me a breakdown of every students performance against every specification objective/concept.
Since then I’ve been experimenting with how I could use the data to improve my students performance. In this blog post I’ll give details of the students performance after those interventions (I’ll write another blog post about the specific intervention approaches I tried).
Interventions complete, I tested the students again with the same test as before (so I could use the same spreadsheet). It was approximately 3 months since they’d last seen the test, and so highly unlikely that they’d remember much about the questions.
Below are two screenshots of the spreadsheet breakdown of the test results for every spec objective, before and after interventions (the student numbers are not the same as in the previous blog post as some students were not present for the second test, so have been removed). The RAG thresholds used were: 0-39% red, 40-69% amber, 70-100% green.

Breakdown of test 1 against objectives (before interventions).

Breakdown of test 2 against objectives (after interventions).
It can clearly be seen that many improvements have been made for all students. The screenshot for test 2 as well as showing the individual strengths and weaknesses of the students, also shows that most students still struggle with certain areas, mainly to do with red-shift and the universe (although some improvements have been made in those areas).
Previously I’d identified the ‘use of the wave equation’ objective as a priority for interventions, as the first test had showed that few students could use the equation, and those that could had trouble using it when given data in standard index form. This objective increased overall from 21% in test 1 to 51% in test 2. Interrogation of the marks showed that now most students could use the wave equation correctly, but they still struggled with numbers in standard index form. So this is something that requires ongoing work.
To quantify the improvement, the number of red, amber and green objectives was totalled for both tests and the percentage change calculated (shown below).

Percentage changes in number of red, amber and green objectives following interventions.
The rows highlighted in orange are for those students who joined my class from another just before I administered the first test but hadn’t been taught the Waves topic.
These numbers show that on average the entire class increased their proficiency in a third of the objectives. The students who had not been taught the topic previously (and so had only been exposed to the material during the interventions) unsurprisingly showed a bigger increase – 52% on average. The students who had been taught the topic previously increased by just under a third. However some individual students made much bigger gains (83% and 50%). This gives me valuable evidence of not only what I have done with the students, but also of how individual students have responded to the interventions, and so how they are likely to respond to interventions in the future.
My spreadsheet also calculated the percentage scores for multiple choice and non-multiple choice questions, as well as higher and foundation tier questions, and the overall percentage for the entire test. These numbers are shown below for both tests (again the students not taught the topic prior to test 1 are highlighted).
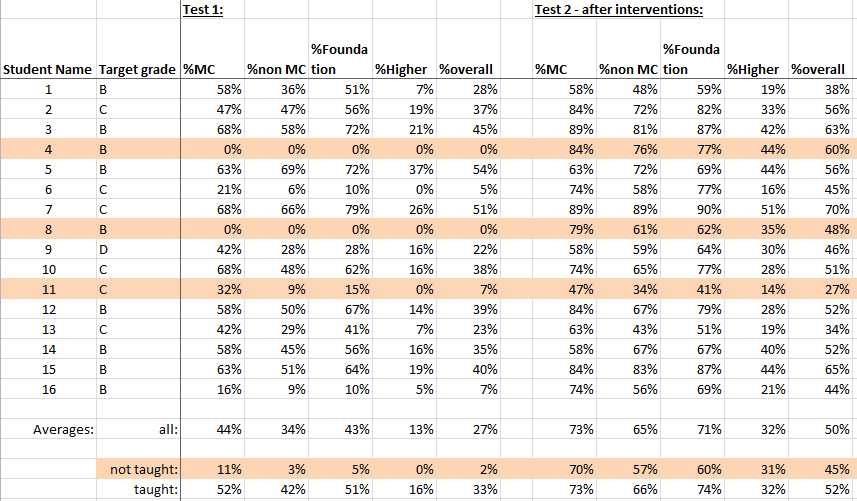
Overall figures for different question types and the whole test.
From these figures I calculated the percentage change between tests, which are below.

Percentage change in the overall figures for different question types and the whole test.
This shows that students increased in all areas of the test, but the increase was less for the higher tier questions; so this is an area in need of further work.
From this exercise I’ve learned not only the individual strengths and weaknesses of students but also what parts of the topic students struggle with the most (and so requires further work), and how individual students respond to interventions. It also gives me clear evidence of what I’ve done in the classroom and the results of my interventions. In my next blog post I’ll be writing about what intervention strategies I tried and how successful they were.

Pingback: Improving Student Performance – Interventions | EviEd
Hi would like to hear about your intervention strategy?
I’ve written more about what I’ve done with students here https://eviedblog.wordpress.com/2014/11/01/improving-student-performance-interventions/